Our highest profile Data Science and AI Projects Data Visualization
You’ve got the data. But now how best to communicate it? With data visualization, we use advanced tools to map data into accessible, real-time images, making it easier to spot outliers, patterns, and other trends.

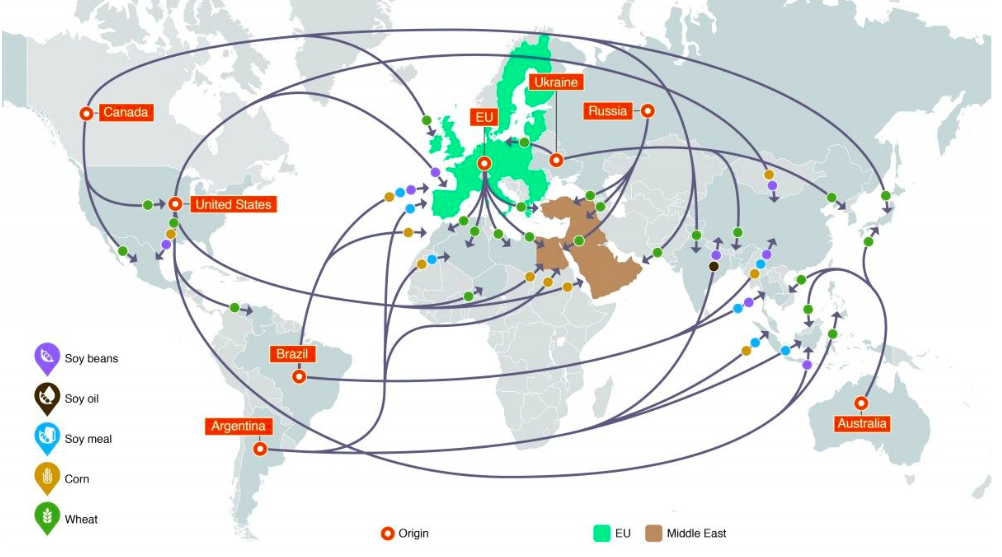
The World Food Imports
A geographical heat map shows the world food imports and their countries of origin, the quantity and types of imports, and relevant entrance port data. This helps agencies decide on the type of resources needed and where these are best allocated. For instance, if one port imports many Chinese goods, having a Chinese interpreter on duty will be called for.
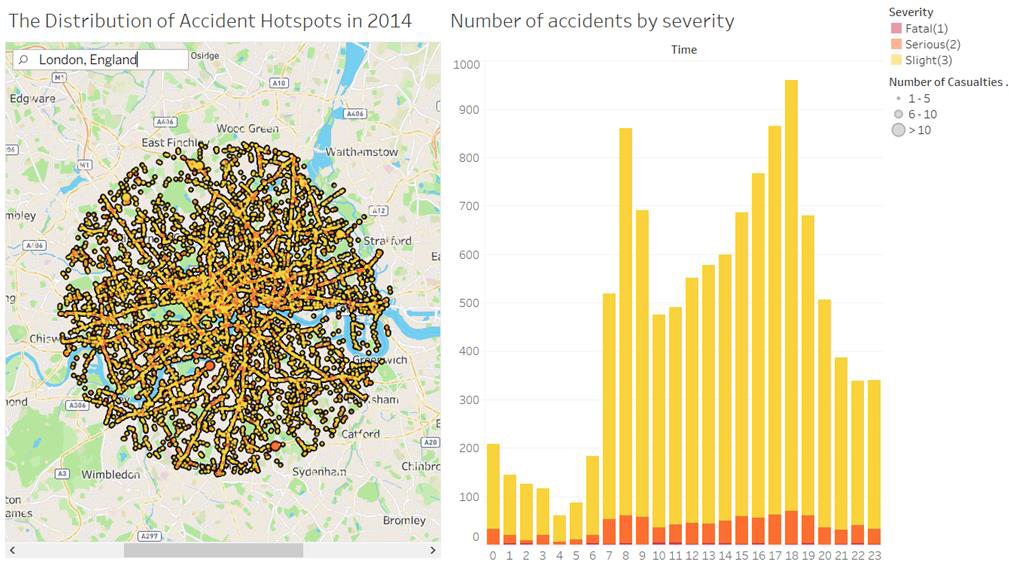
Road Accident Visualization – Analysis for the Sake of Consciousness in the UK
Studying car accident data can give us a window into the various causes of car accidents, the conditions that initiate them, and the places where accidents are most likely to occur. This kind of data can inform where new traffic laws may be needed and where they can be relaxed. This not only helps legislators craft better traffic policies, but it can also save lives when used in conjunction with a strong public outreach campaign.

